Bias Incidents: 1990-Present
Incidents by County
Incidents by Motivation
Incidents by Target
Incidents by Type
Average Severity of Incidents
Composite Severity of Incidents
Incidents by City/Town
Incidents by City/Town (%)
Incidents per Capita
Average Severity by City
Incident Type by City
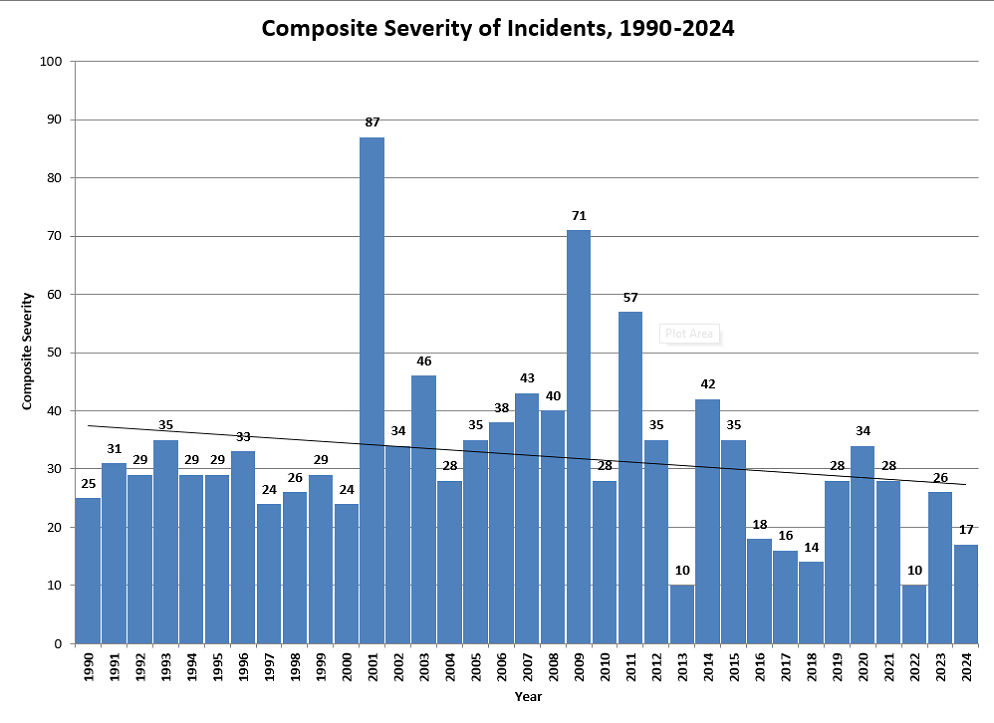
Composite Severity of Incidents, 1990-2024
A severity score between 1 and 5 is assigned to each incident, with 1 being the least severe and five being the most severe. This figure presents a composite severity index. To compute this index, the average severity for that year was multiplied by the number of incidents that year. The index represents the combined effect of the number of incidents and their severity. As indicated, when looked at from this perspective, there was a steady increase in the composite severity of bias related incidents between 1990 and 2009. Since 2009 there have been wide fluctuations in composite severity scores. The composite severity scores have varied since 2014, though.